

If you stick closely to projections (as I do) and play a lot of keeper leagues (as I do), you take the long view on hitters most of the time. They’ll come back around and play to the talent levels they’ve shown before, of course, why wouldn’t they? Projections look at the sum of a player and put together the good times and the bad times and produce the most likely outcomes, and usually, those are about as rosterable as they were when you acquired the player.
Advertisement
But sometimes even the projections move enough on a player that we should recalibrate our feelings. If you’ve lost the projection systems, you’ve lost your last defender.
To see which players have seen their projections move the most, I took preseason OOPSY projections from Jordan Rosenblum and compared them to his rest-of-season projections. Here are the 15 players who have seen their projections move downward the most compared to preseason expectations. I’ve listed them along with their Yahoo roster rates.
Biggest droppers in projected OPS
| Name | RoS OPS | Pre OPS | Diff | Yahoo Own% |
|---|---|---|---|---|
|
0.713 |
0.778 |
-0.065 |
68% |
|
|
0.746 |
0.802 |
-0.056 |
27% |
|
|
0.780 |
0.833 |
-0.053 |
98% |
|
|
0.769 |
0.819 |
-0.050 |
89% |
|
|
0.751 |
0.800 |
-0.049 |
22% |
|
|
0.746 |
0.794 |
-0.048 |
45% |
|
|
0.857 |
0.904 |
-0.047 |
96% |
|
|
0.741 |
0.780 |
-0.039 |
79% |
|
|
0.659 |
0.697 |
-0.037 |
4% |
|
|
0.940 |
0.976 |
-0.036 |
99% |
|
|
0.691 |
0.727 |
-0.036 |
38% |
|
|
0.750 |
0.785 |
-0.035 |
76% |
|
|
0.728 |
0.762 |
-0.034 |
5% |
|
|
0.841 |
0.875 |
-0.034 |
99% |
|
|
0.745 |
0.778 |
-0.033 |
65% |
There are already some obvious flaws with this approach. There are the hitters who might have taken a haircut but are still projected among the best hitters in the game, like Juan Soto, Mike Trout, and Gunnar Henderson. Nobody is advocating dropping these players. League average OPS is .712, and they’re all 100-plus points clear of that, even with their reduced projections. There are also hitters here who will provide fantasy value with their legs, as Matt McLain, Michael Harris II, and, to a lesser extent, Kristian Campbell and Spencer Steer are non-zeroes on the basepaths. And then there are players who nobody had rostered anyway, like Joey Ortiz. Ahem.
So let’s try this another way. Which hitters have seen their OPS projections drop at least 10 points, but are sorted by the worst OPS projections (minimum 250 projected plate appearances)? Surely these players are not great, and maybe also on the precipice of losing their jobs?
Projection droppers with poor OPS
| Name | RoS OPS | Pre OPS | Diff | Yahoo Own% |
|---|---|---|---|---|
|
0.607 |
0.626 |
-0.019 |
0% |
|
|
0.617 |
0.633 |
-0.017 |
1% |
|
|
0.624 |
0.650 |
-0.027 |
3% |
|
|
0.635 |
0.652 |
-0.017 |
0% |
|
|
0.659 |
0.681 |
-0.022 |
13% |
|
|
0.659 |
0.697 |
-0.037 |
4% |
|
|
0.662 |
0.690 |
-0.028 |
4% |
|
|
0.663 |
0.689 |
-0.026 |
1% |
|
|
0.663 |
0.684 |
-0.021 |
15% |
|
|
0.667 |
0.678 |
-0.011 |
13% |
|
|
0.669 |
0.688 |
-0.019 |
17% |
|
|
0.670 |
0.691 |
-0.021 |
62% |
|
|
0.670 |
0.690 |
-0.020 |
7% |
|
|
0.670 |
0.682 |
-0.012 |
34% |
|
|
0.671 |
0.682 |
-0.010 |
1% |
Nobody on this list was projected to have a league average OPS, and then they played so poorly that they saw their projections drop further. Speed once again is a complicating factor, but it’s still instructive to note that while Parker Meadows has the defensive chops to keep his job despite poor OPS projections, the Miami Marlins just moved Xavier Edwards to second base. He’s a sell in keeper formats if he has any value, because legs can only take a player so far. The next problem is that once you scan over to the roster levels, you’ll see that nobody was really all-in on these players anyway, with a notable exception or two.
Advertisement
We still have the stolen base problem. Let’s try one last way. Here are the players who have lost the most projected fantasy value since the preseason, using OOPSY in the FanGraphs auction calculator with 15-team Roto 5×5 settings. I’ve removed players who are currently in the minors or suffering from long-term injury, or who were projected for negative value to begin the season, in order to make this list more useful.
Biggest fantasy value droppers
| Name | RoS$ | Pre $ | Diff |
|---|---|---|---|
|
-17.50 |
4.88 |
-22.38 |
|
|
-13.63 |
3.78 |
-17.41 |
|
|
-10.46 |
5.46 |
-15.92 |
|
|
18.16 |
32.58 |
-14.42 |
|
|
-2.09 |
11.26 |
-13.35 |
|
|
-6.37 |
6.72 |
-13.09 |
|
|
-3.55 |
9.39 |
-12.93 |
|
|
-7.89 |
3.13 |
-11.02 |
|
|
4.42 |
13.54 |
-9.12 |
|
|
-1.29 |
7.41 |
-8.70 |
|
|
-0.22 |
8.41 |
-8.63 |
|
|
6.77 |
14.98 |
-8.21 |
|
|
4.16 |
11.80 |
-7.65 |
|
|
2.32 |
9.55 |
-7.23 |
|
|
2.88 |
9.80 |
-6.92 |
This once again has some less-than-useful information. Nobody is still holding on to Orlando Arcia at this point since he lost his starting job and is a utility player, and ownership levels in a lot of the other categories are pretty low. Nobody is dropping Yordan Alvarez despite the change in projected outcomes. But there are also some interesting names on here for those who were holding out hope for players like Brandon Marsh and Lane Thomas — if they are basically underwater in 15-teamers with five outfielders, by sober projections, then there’s no reason to keep holding them for the future in most leagues.
Let’s highlight five bats who have shown up on a lot of these lists but aren’t slam-dunk drops at first glance.
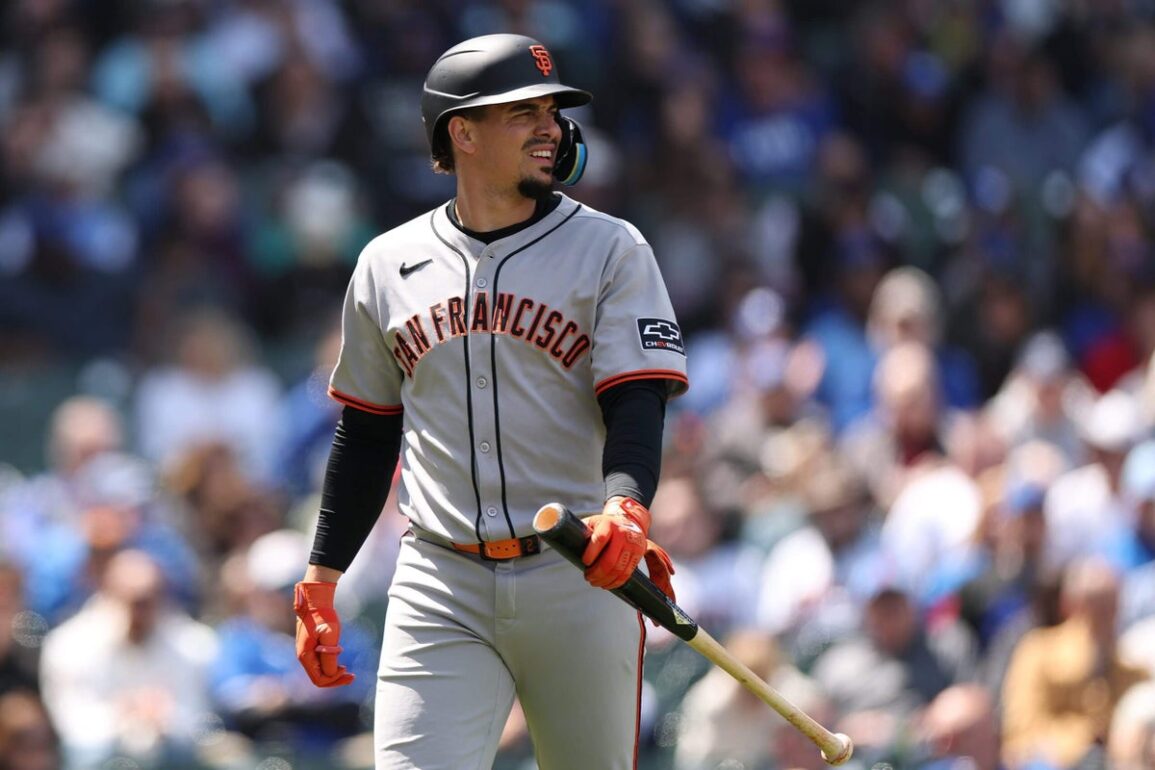
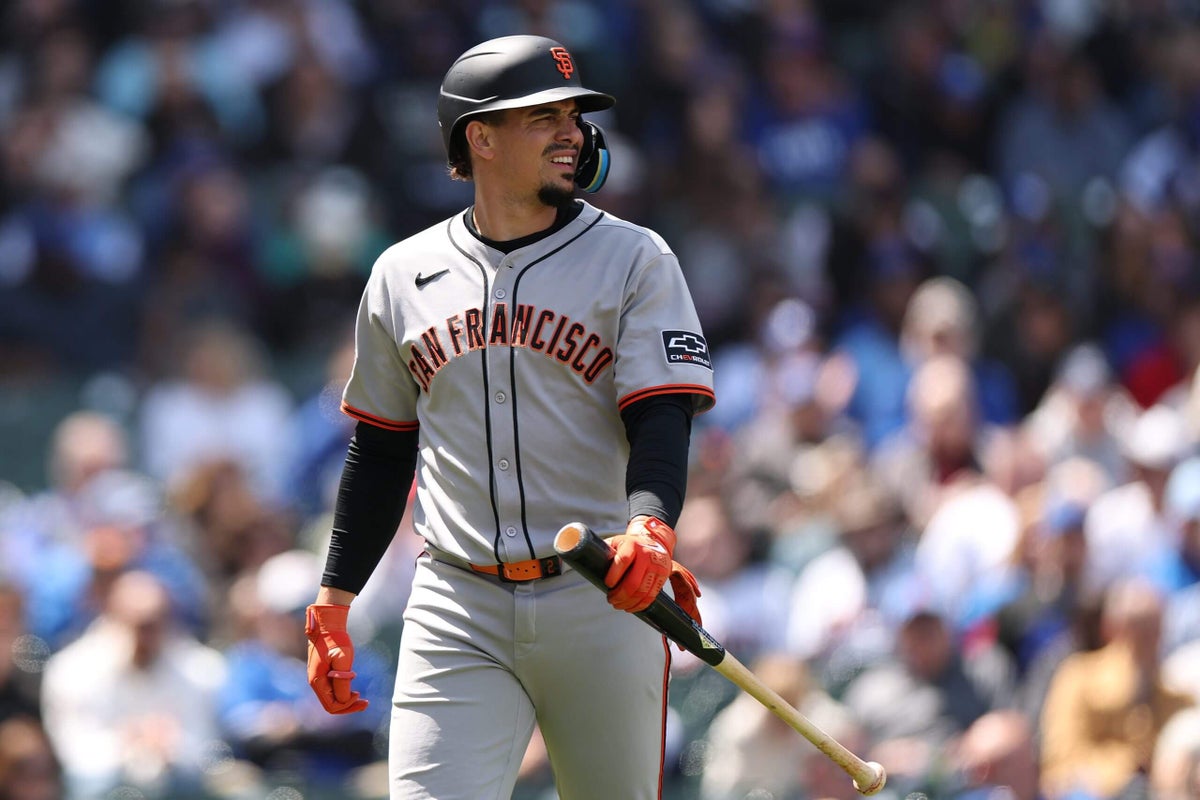
Willy Adames, San Francisco Giants (79% rostered)
Recently, Adames has performed a little better, and that coincides with his rolling swing speed finally poking about the 75th percentile for the first time this season. But it’s a long swing, and if you judge him instead by swing acceleration (which considers contact point), he just nudged above the 10th percentile. The thing is, we’ve seen this from Adames before, so it’s not too surprising. Many of his numbers seem right in line with what he did in 2023, when he had a .217 average and hit 24 homers (except worse in the power department, really). That year, he was the 20th-best shortstop when all was said and done. Even if he picks it up and ends up near those numbers, the stolen bases aren’t going to be there like last year, and maybe there’s someone out there who can be better than 20th for you at the position?
Matt McLain, Cincinnati Reds (68%)
He’s still a $3 player in 12-team leagues with a middle infield slot, according to OOPSY rest-of-season projections, but that’s droppable territory if you see something better out there. Of the players highlighted here, McLain is the toughest drop for a couple of reasons, though. First, second base is a really tough position this year. It’s only produced six players who would be above-replacement players without the positional adjustment (shortstop has 16), and the lesser-rostered, better-projected second basemen ahead of McLain (Jonathan India, Luis Garcia Jr.) aren’t slam-dunk decisions. Second, he’s stealing bases and likely to finish the season with at least a shot at a 20-20 season. But the batting average isn’t going to be great, and the power, which wasn’t supported fully by his batted-ball stats, has not returned (and wasn’t helped by a loss of bat speed). If the steals won’t mean that much to you, McLain could be a drop in shallower leagues.
Anthony Santander, Toronto Blue Jays (65%)
Everything has gone badly for Santander in Toronto. The strikeout rate went up (career-worst), the fly-ball rate went down, the hard-hit rate went down (five-year low), as did his barrel rate (career-worst) and max exit velocity (career-worst). His bat has lost over a mile per hour of bat speed (to the point that it’s almost average from the left side), and his swing has gotten flatter in terms of tilt, so he’s just pulling balls on the ground now. Jorge Soler, who is rostered in a third of the leagues as Santander, is projected to be better. In the deepest leagues, you just have to hold and hope, but projections have him under $3 going forward in 15-team leagues with players like Alec Burleson and the returning Luke Raley ranked higher. You probably have a better option on your wire versus waiting for him to get healthy.
Advertisement
Spencer Steer, Cincinnati Reds (38%)
Steer’s lack of bat speed this year can indeed be most likely attributed to his spring injury to the shoulder, but it’s also true that there’s no evidence in his rolling swing speed graphs that the joint is feeling any better in recent days. Keeper league players have a harder decision — Steer could use a full healthy offseason, most likely, and any return of bat speed could make him a viable 20-10 guy again — but in leagues playing just for 2025, the four stolen bases aren’t enough to hang around for. Christian Encarnacion-Strand projects better and is out there in nearly three-quarters of Yahoo leagues, and if you need some stolen bases, Jake Cronenworth is rostered in fewer leagues and projects better. There are better options than Steer right now in all but the deepest leagues.
Trevor Story, Boston Red Sox (34%)
In 12-team leagues with a middle infielder slot, OOPSY projects Story to be below replacement, which might be surprising at first. He has double-digit homers and steals and has had his moments this year. But the real tragedy of leaving Coors Field behind is that his batting average is no longer buoyed by altitude. Now he strikes out 30 percent of the time and has the batting average to match. It’s a bit like McLain — how much batting average do you want to pay for your 20/20 season — but at a position where there are more options. Even if you want power and speed, Masyn Winn and Ezequiel Tovar might be able to help you without hurting in batting average as much. Looking at roster rates, though, Story has probably already been dropped in most leagues where he should have been, and is a tentative hold in the deepest leagues.
(Photo of Willy Adames: Michael Reaves / Getty Images)
This post was originally published on this site be sure to check out more of their content.